Oncoscience
In situ analysis of Her2 DNA and RNA in retinoblastoma and adjacent retina
Gail M Seigel1, Dhaval K Shah2, Pia Mendoza3, Ezster Szalai3, Hans Grossniklaus3, Yinghui Song4, Jidong Shan4
1 University at Buffalo, Center for Hearing and Deafness, Buffalo, NY
2 University at Buffalo, Department of Pharmaceutical Sciences, Buffalo, NY
3 Emory Eye Center, Emory University, Atlanta, GA
4 Molecular Cytogenetic Core, Albert Einstein College of Medicine, NY
Correspondence to: Gail M. Seigel, email: [email protected]
Keywords: Retinoblastoma; Her2; Adjacent tissues
Received: April 04, 2019
Accepted: May 15, 2019
Published: August 23, 2019
Copyright: Seigel et al. This is an open-access article distributed under the terms of the Creative Commons Attribution License 3.0 (CC BY 3.0), which permits unrestricted use, distribution, and reproduction in any medium, provided the original author and source are credited.
ABSTRACT
Retinoblastoma (RB) is an ocular tumor of early childhood. Current treatments attempt to preserve visual function, but may spare chemoresistant tumor cells. One potential therapeutic target for RB is HER2, (ERBB2), expressed in RB in truncated form. In this study, we tested the hypothesis that Her2 DNA and RNA are expressed in RB tumors and adjacent retina. We examined 24 human RB tumors as well as normal-appearing adjacent retinal tissues for Her2 DNA and RNA expression by in situ hybridization. We also examined 28 RB tumors for HER2 protein immunoreactivity. 21/22 RB tumors expressed Her2 DNA and 14/19 tumors expressed Her2 RNA. In 17 paired cases, there were three cases in which Her2 DNA was detected, but not RNA. We also saw Her2 RNA signal in six instances of “normal” adjacent retinal tissue. Heterogeneous HER2 protein expression in specific tumor regions also was confirmed by quantitative HER2 immunohistochemistry. In summary, Her2 DNA and RNA are expressed in many RB tumors, and in some adjacent ocular tissues, with hetereogenous protein expression throughout. These results may provide important insights regarding RB tumor progression, and drug targeting approaches designed to spare the eye, preserve vision and improve quality of life for RB patients.
INTRODUCTION
Human epidermal growth factor receptor 2 (HER2, ERBB) is a cancer biomarker and drug target encoded on human chromosome 17q21–22 [1]. It is expressed in a variety of malignancies [2, 3, 4, 5] and is associated with a poor prognosis [6]. Recently, our group reported on HER2 expression in retinoblastoma, an ocular tumor of childhood [7]. This was an unexpected finding at the time, since a previous study had suggested that HER2 would not be expressed in RB [8]. This negative prediction was based on immunohistochemistry of RB tumors using only one antibody [8]. Our results provided a potential explanation for this inconsistency, as the HER2 expressed in retinoblastoma appeared to be a truncated protein, not detectable by some antibodies directed against the missing portions of the protein [7].
Our 2016 study demonstrated HER2 expression in retinoblastoma tumors (and its absence in normal ocular tissues) by multiple methods, including immunohistochemistry, flow cytometry, RT-PCR and western immunoblot [7], but not in situ hybridization. This study focused on the tumor itself, without analysis of adjacent retinal tissues. A subsequent study by Sousa and colleagues questioned the extent of HER2 expression in retinoblastoma, as the protein was immunonegative in 49/60 retinoblastoma cases and very low in 11/60 cases that they tested [9]. Since the Sousa study involved one of the same antibodies used in our study (Sigma, HPA001383), the simplest explanation for this conflicting result was a difference in methodology (shorter incubation periods, different detection methods).
Our present study demonstrates new and important characteristics of Her2 expression in retinoblastoma by analyzing DNA and RNA expression in retinoblastoma tumors, including adjacent retinal tissue, as well as regional Her2 immunoreactivity within the tumor itself. To this end, we examined 24 retinoblastoma tumors and adjacent ocular tissue by fluorescent and colorimetric in situ hybridization, specifically DNA-FISH and RNA-CISH. We followed up with additional HER2 immunohistochemistry of 28 RB tumors in different zones (central tumor, transitional zone, leading edge, vitreous seeds) to assess regional differences in HER2 immunoreactivity. Positive results in RB tumors and adjacent tissues reveal the utility of FISH-DNA and CISH-RNA analysis in assessing Her2 expression in retinoblastoma for potential drug targeting approaches and studies of tumor progression.
RESULTS
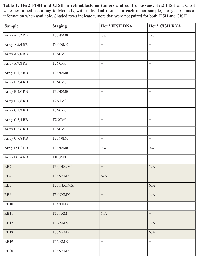
For FISH and CISH analyses, a total of 24 retinoblastoma cases were examined, with 17 paired cases that were tested for both FISH and CISH. A summary of these results is shown in Table 1, with the unpaired cases shaded. For FISH, a total of 21/22 RB tumors expressed some Her2 DNA, while 14/19 RB tumors expressed some Her2 RNA by CISH. For direct comparison, 17 paired RB cases were tested for both FISH and CISH; in three of these cases Her2 DNA was detected, but not RNA.
Visualization of Her2 DNA-FISH in RB
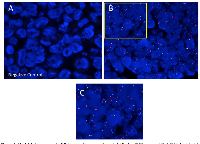
DNA-FISH results were visualized by fluorescent microscopy, with representative images shown in Figure 1. Her2 signals (red) are visible in panels B and C that contrast with the negative control probe image in panel (A). Although there was heterogeneity of Her2 DNA expression among the tumors examined, there was clear Her2 DNA expression in 22/23 of tumors tested. The only Her2 negative tumor by DNA-FISH was tumor RB10, staged as T2aN0MX, with minimal tumor spread.
Visualization of Her2 RNA-CISH in RB
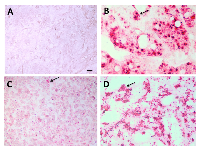
RNA-CISH results were visualized by brightfield microscopy, with examples shown in Figure 2. A Her2 negative adrenal gland tumor (panel A) and a positive control Her2+ xenograft (panel B) are seen in comparison with Her2-expressing RB tumors (low-moderate, Panel C; high, Panel D). Her2 RNA expression was detected in 14/19 RB tumors tested, with some heterogeneity within the tissues. In 17 paired cases of RB tested for both DNA-FISH and RNA-CISH, there were three cases in which we did not detect Her2 RNA, although these samples did express Her2 DNA as shown in Table 1.
Her2 expression in adjacent retina and optic nerve
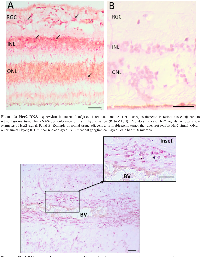
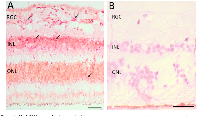
Histologically normal tissue adjacent to a tumor is often used as control tissue in comparative tumor studies. However, little is known about the characteristics of this adjacent tissue, how it is influenced by the tumor, and how it compares with non-tumor-bearing tissues. We took this opportunity to examine normal adjacent retinal tissue in these RB cases to determine whether we could detect Her2. In six separate RB cases, we observed Her2 DNA and/or RNA expression in the adjacent retina, one example
Sample Staging Her2 FISH DNA Her2 CISH RNA
Her+ xenograft (pos control)N/A + + Adrenal tumor (neg control)N/A − − of which is shown in Figure 3. These Her2 signals were predominantly localized to the inner nuclear layer (INL) and outer nuclear layer (ONL) of the histologically normal adjacent retina, although we did see some signal in the ganglion cell layer as well. We also saw an example of increased Her2 signal in optic nerve adjacent to a blood vessel (BV), as shown in Figure 4.
Immunoreactivity of HER2 in various regions of the tumor
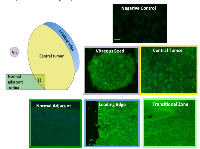
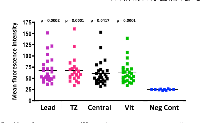
In order to correlate FISH and CISH analysis with protein expression, (particularly in the transitional zone between tumor and adjacent tissue), we examined 28 RB tumors for HER2 immunoreactivity in various regions of the tumor, including the leading edge, central tumor, vitreous seeds and transitional zone between the tumor and adjacent tissue. Examples of these regions are illustrated in Figure 5. We analyzed these images with Image J to assess fluorescence intensity. Normal adjacent retinal tissue was not included in ImageJ analysis, as there were not enough cases or areas of clear-cut normal adjacent tissue to be able to determine statistical significance. In general, however, we did not see intense HER2 immunoreactivity in normal adjacent retina (example shown in Figure 5). Of the 28 RB tumors examined, 14 were brighter than 2 standard deviations above the negative control, with p values ranging from 0.0001 to 0.0417 (Figure 6). All regions assessed were statistically more fluorescent than negative controls, with heterogeneity between individual tumors and within each tumor section. When we compared mean fluorescence intensity between the different HER2-stained tumor regions with one another, there was no significant difference.
DISCUSSION
DNA-FISH vs. RNA-CISH and protein expression
We utilized both fluorescent and colorimetric in situ hybridization as a means to localize Her2 DNA and RNA in retinoblastoma tumors and adjacent tissues. In general, RNA in situ hybridization for Her2 has a strong correlation with FISH-DNA analysis and immunohistochemistry [12]. Interestingly, there was not complete concordance between our DNA-FISH and RNA-CISH results. Table 1 indicates that in 17 paired cases of RB tested for both DNA-FISH and RNA-CISH, there were three cases in which Her2 DNA was expressed but not Her2 RNA. This is not entirely unexpected, since RNA is a downstream nucleic acid product that is subject to transcriptional regulation [13]. Although RNA is less stable than DNA in fixed tissue [14], the tumor array cores were prepared and cut within a few weeks of analysis. Therefore, transcriptional regulation is the most likely explanation for the three RB cases that expressed Her2 DNA but not RNA.
In addition to CISH and FISH, we examined 28 RB tumors for HER2 immunoreactivity in various regions of the tumor, including in the transitional zone between tumor and adjacent retinal tissue. Half of the tumors were considered HER2 immunoreactive (at least two standard deviations of brightness above the negative control), a smaller percentage of IHC positive tumors compared with FISH or CISH. This difference is likely due to the fact that i) these IHC tumors were not matched with FISH and CISH tumors due to tissue availablity and ii) protein expression of HER2 relies upon not only DNA expression, but also RNA expression and translation of mRNA into protein. So, it is not surprising that there would be fewer tumors immunoreactive for HER2 than Her2 positive for FISH or CISH. However, the immunoreactivity of 14/28 RB tumors using the Sigma, HPA001383 antibody, in conjunction with our CISH and FISH data, reinforce our hypothesis that Her2 is expressed in many retinoblastoma tumors at the DNA, RNA and protein levels.
Her2 expression in normal adjacent tissue
Histologically normal tissues adjacent to a tumor are often designated as “healthy control tissues” for comparative cancer studies, with the assumption that a histologically normal morphology translates to normal cell behavior. However, normal-appearing tissues adjacent to tumors may express abnormal transcriptomes [15], or exhibit other atypical characteristics, such as activated inflammatory and immune responses [16]. In human breast cancer, altered Her2 expression has been detected in 5% of peritumoral tissues [17].
In our study of RB adjacent retinal tissue, Her2 expression is evident prior to histological transformation, particularly in the inner and outer nuclear layers of the retina. This result is especially intriguing, since live imaging of RB tumors in patients shows that early lesions are visible in the inner nuclear layer of the retina [18] and suggests that the elusive RB “cell of origin” may arise from the middle layers of the retina [19], in the same regions where we saw Her2 RNA expression in normal-appearing tissues. We also saw increased Her2 RNA signal in cells surrounding a blood vessel in the optic nerve of a tumor-bearing eye, which may be evidence of ongoing metastasis [20]. Importantly, our earlier study of normal human retina (without retinoblastoma) showed no Her2 expression, either by immunohistochemistry or by qRT-PCR [7]. Therefore, the expression of Her2 in tumor-adjacent, morphologically normal retinal tissue and optic nerve of tumor-bearing eyes provides a new clue in the study of RB tumor progression and malignant transformation.
Her2 expression and cancer stem cells
Many tumors contain a small percentage of cancer stem cells, with the ability to self-renew, metastasize, and confer chemoresistance (for review see [21]). Previous work from our group, confirmed by others, has demonstrated the presence of these cancer stem cell markers in human retinoblastoma [22, 23, 24, 25]. We know that in breast cancer, Her2 expression and overexpression is associated with a cancer stem cell phenotype (for Review, see [26]). Her2 overexpression is associated with an increased subpopulation of cancer stem cells and correlates with activation of the PI3K/AKT pathway, leading to increased expression of stem cell markers Oct3/4, Notch1, Notch2, Jagged1 and Gli1 [27]. In retinoblastoma, we do not have as much information on the role of Her2 in the modulation of cancer stem cell behavior. However, we do know that the expression of Her2, a truncated protein in retinoblastoma [7], remains intact at the trastuzumab binding site, with potential as a target for anti-HER2 therapy [28]. The expression of Her2 in adjacent retina and optic nerve may be relevant to the progression of retinoblastoma, and the effect of the tumor microenvironment on surrounding retinal tissues. In turn, our findings on Her2 expression in RB and adjacent tissues may aid in our development of strategies to target Her2 as a viable drug target or prognostic indicator in retinoblastoma.
METHODS
Tissue Samples
All human tissues in this study came from de-identified pathology cases and were considered exempt as defined by the Common Rule 45 CFR 46.102. For all experiments, paraffin-embedded human retinoblastoma samples were assessed from two sources: a repository at the Emory University Ocular Pathology Lab, and a retinoblastoma tissue array BC35111a (US Biomax, Derwood, MD). Control slides included a Her+ xenograft, and a Her2 negative phaeochromocytoma tumor that was part of the tissue array.
Her2 FISH
The Her2 FISH method was used to detect Her2 DNA in retinoblastoma tissues, “normal” adjacent retina, along with control tissues. Paraffin slides were baked at 60ºC overnight and treated with Citrisolv (Fisher Scientific, Pittsburgh, PA) three times for 10 min at room temperature, followed by 100% ethanol, twice for 10 min at room temperature and allowed to air dry. The slides were incubated in pretreatment buffer (Vysis Paraffin Pretreatment Solution, 30-80600 which is from Vysis Paraffin Pretreatment Reagent Kit, 32-801200, Abbott Des Plaines, IL) at 80º C for 30 min. The slides were rinsed in washing buffer (2x SSC) at room temperature for 5 min, and then transferred to ddH2O at room temperature for 5 min. The slides were then treated with protease (Vysis protease, 30-806001) at 37ºC for 15 min, rinsed in washing buffer (2x SSC) at room temperature for 5 min, followed by ddH2O, at room temperature for 5 min. The slides were taken through a series of alcohols (70%, 90% and 100% EtOH) for 3 min each and allowed to air dry. Co-denaturation of the slide and probe was performed at 76ºC for 5 min. The Her2 BAC clone probe (RP11-1065L22, RP11-449M14, made in-house) (Roohi, et al., 2008) was hybridized at 37ºC overnight, then rinsed in 4x SSC/0.1% Tween 20. This was followed by a series of washes: 2xSSC/0.3% Nonidet-P40 at 72ºC for 2 min, 4xSSC/0.1% Tween-20 at room temperature for 3 min, and a final series of alcohols (70%, 90% and 100% EtOH), 3 min each. The slides were allowed to air dry and coverslipped with DAPI/antifade mounting medium (Applied Spectral Imaging, Carlsbad, CAFPRPR0006).
HER2 CISH
For colorimetric in situ hybridization of RNA (RNA-CISH), we used a highly specific RNAScope Fast Red kit (Advanced Cell Diagnostics, Newark, CA) and Her2/Erbb2 human probe (#310081, RNAscope Probe - Hs-ERBB2; Advanced Cell Diagnostics) to detect RNA. For a positive control human probe, we used ubiquitin (#310041, RNAscope® Positive Control Probe - Hs-UBC, Advanced Cell Diagnostics). The RNA in situ method was carried out according to the RNAScope kit instructions, with a two hour probe hybridization at 40ºC.
HER2 immunoreactivity
For immunohistochemistry, we examined 28 paraffin-embedded RB tumors using a rabbit anti-HER2 antibody (Sigma, HPA001383) according to our standard protocol [11]. Due to availability of tissue sections, these immunohistochemistry samples were not paired with the CISH and FISH samples. Briefly, we baked paraffin slides for 60 minutes at 60°C, incubated the sections with a series of xylene and alcohols, boiled in antigen retrieval solution (sodium citrate, pH 6.0), and blocked for fifteen minutes at room temperature in 1% bovine serum albumin, 0.5% Triton-X100 in PBS. Slides were incubated in anti-Her2 primary antibody (Sigma HPA001383) at 5ug/ml (or isotype control antibody) for one hour at room temperature. Slides were washed three times in PBS and then incubated in FITC conjugated anti-rabbit secondary antibody (Sigma, stock concentration listed as ranging from 3–6.5 mg/mL), diluted 1:400 in PBS. Slides were cover-slipped and photographed with a Nikon E600 microscope (Melville, NY) equipped with a Spot digital camera and Spot Advanced software (Sterling Heights, MI). We measured fluorescence staining intensity using Image J software, with three image samplings per section in the regions being measured. Some tumor sections did not have discernable regions for every parameter being measured, which accounts for the varying number of spots on each graph. Fluorescence intensities were averaged for each measurable region of the tumor, compared with fluorescence intensities of negative control images in that region, analyzed by one way ANOVA and graphed using Prism (Graphpad, San Diego, CA) software.
ACKNOWLEDGEMENTS
This work was supported by the Childhood Eye Cancer Trust (GMS, DKS) and will be presented in poster form at the Association for Research in Vision and Ophthalmology conference in Vancouver, CA in May 2019.This paper is dedicated to the memory of Kenyan Child Life Specialist Jayne Kamau, and family support coordinator Bella Jaboma, who died aboard Ethiopian Airlines flight ET302 on March 10th, 2019 returning from the International Society of Paediatric Oncology Africa Congress in Cairo.
CONFLICTS OF INTEREST
The authors declare no potential conflicts of interest.
- 1. The biology of erbB-2/neu/HER-2 and its role in cancer. Biochim Biophys Acta. 1994; 1198:165–84. https://doi.org/10.1016/0304-419X(94)90012-4. [PubMed].
- 2. HER2 in gastric cancer: a new prognostic factor and a novel therapeutic target. Ann Oncol. 2008; 19:1523–29. https://doi.org/10.1093/annonc/mdn169. [PubMed].
- 3. HER2 status in premalignant, early, and advanced neoplastic lesions of the stomach. Dis Markers. 2015; 2015:234851. https://doi.org/10.1155/2015/234851. [PubMed].
- 4. HER2 (c-erbB-2) oncoprotein expression in colorectal adenocarcinoma: an immunohistological study using three different antibodies. J Clin Pathol. 1992; 45:726–27. https://doi.org/10.1136/jcp.45.8.726. [PubMed].
- 5. HER2 expression beyond breast cancer: therapeutic implications for gynecologic malignancies. Mol Diagn Ther. 2013; 17:85–99. https://doi.org/10.1007/s40291-013-0024-9. [PubMed].
- 6. Human breast cancer: correlation of relapse and survival with amplification of the HER-2/neu oncogene. Science. 1987; 235:177–82. https://doi.org/10.1126/science.3798106. [PubMed].
- 7. HER2/ERBB2 immunoreactivity in human retinoblastoma. Tumour Biol. 2016; 37:6135–42. https://doi.org/10.1007/s13277-015-4475-y. [PubMed].
- 8. Expression and amplification of therapeutic target genes in retinoblastoma. Graefes Arch Clin Exp Ophthalmol. 2005; 243:156–62. https://doi.org/10.1007/s00417-004-1036-2. [PubMed].
- 9. HER2 Overexpression in retinoblastoma: A potential therapeutic target? Ocul Oncol Pathol. 2017; 3:210–15. https://doi.org/10.1159/000455871. [PubMed].
- 10. An improved method for generating BAC DNA suitable for FISH. Cytogenet Genome Res. 2008; 121:7–9. https://doi.org/10.1159/000124374. [PubMed].
- 11. Immunoreactivity of pluripotent markers SSEA-5 and L1CAM in human tumors, teratomas, and induced pluripotent stem cells. J Biomark. 2013; 2013:960862. https://doi.org/10.1155/2013/960862. [PubMed].
- 12. HER2 status determination using RNA-ISH—a rapid and simple technique showing high correlation with FISH and IHC in 141 cases of breast cancer. Histol Histopathol. 2012; 27:1021–27. https://doi.org/10.14670/HH-27.1021. [PubMed].
- 13. A novel HER2 gene body enhancer contributes to HER2 expression. Oncogene. 2018; 37:687–94. https://doi.org/10.1038/onc.2017.382. [PubMed].
- 14. Cronin M, Pho M, Dutta D, Stephans JC, Shak S, Kiefer MC, Esteban JM, Baker JB. Measurement of gene expression in archival paraffin-embedded tissues: development and performance of a 92-gene reverse transcriptase-polymerase chain reaction assay. Am J Pathol. 2004; 164:35-42. https://doi.org/10.1016/S0002-9440(10)63093-3. [PubMed].
- 15. Comprehensive analysis of normal adjacent to tumor transcriptomes. Nat Commun. 2017; 8:1077. https://doi.org/10.1038/s41467-017-01027-z. [PubMed].
- 16. Tumor intrinsic subtype is reflected in cancer-adjacent tissue. Cancer Epidemiol Biomarkers Prev 2015; (24) (2) 406-414. https://doi.org/10.1158/1055-9965.EPI-14-0934. [PubMed].
- 17. Phenotypic changes of p53, HER2, and FAS system in multiple normal tissues surrounding breast cancer. J Cell Physiol. 2005; 204:106–12. https://doi.org/10.1002/jcp.20275. [PubMed].
- 18. Hand-held high-resolution spectral domain optical coherence tomography in retinoblastoma: clinical and morphologic considerations. Br J Ophthalmol. 2013; 97:59–65. https://doi.org/10.1136/bjophthalmol-2012-302133. [PubMed].
- 19. Cancer: the origin of human retinoblastoma. Nature. 2014; 514:312–13. https://doi.org/10.1038/nature13748. [PubMed].
- 20. Tahiliani P, Mishra DK, Srinivasan V, Ali MH, Reddy VA. Optic nerve infiltration by retinoblastoma: predictive clinical features and outcome. Retina. 2016; 36:1177–83. https://doi.org/10.1097/IAE.0000000000000861. [PubMed].
- 21. Cancer stem cell impact on clinical oncology. World J Stem Cells. 2018; 10:183–95. https://doi.org/10.4252/wjsc.v10.i12.183. [PubMed].
- 22. Cancer stem cell characteristics in retinoblastoma. Mol Vis. 2005; 11:729–37. [PubMed].
- 23. Human embryonic and neuronal stem cell markers in retinoblastoma. Mol Vis. 2007; 13:823–32. [PubMed].
- 24. In vitro characterization of CD133lo cancer stem cells in Retinoblastoma Y79 cell line. BMC Cancer. 2017; 17:779. https://doi.org/10.1186/s12885-017-3750-2. [PubMed].
- 25. Differential expression of stem cell markers and vascular endothelial growth factor in human retinoblastoma tissue. Korean J Ophthalmol. 2010; 24:35–39. https://doi.org/10.3341/kjo.2010.24.1.35. [PubMed].
- 26. HER2 in breast cancer stemness: A negative feedback loop towards trastuzumab resistance. Cancers (Basel). 2017; 9:40. https://doi.org/10.3390/cancers9050040. [PubMed].
- 27. HER2 regulates the mammary stem/progenitor cell population driving tumorigenesis and invasion. Oncogene. 2008; 27:6120–30. https://doi.org/10.1038/onc.2008.207. [PubMed].
- 28. Biomedical applications of trastuzumab: as a therapeutic agent and a targeting ligand. Med Res Rev. 2015; 35:849–76. https://doi.org/10.1002/med.21345. [PubMed].
Last Modified: 2019-10-07 12:42:53 EDT
